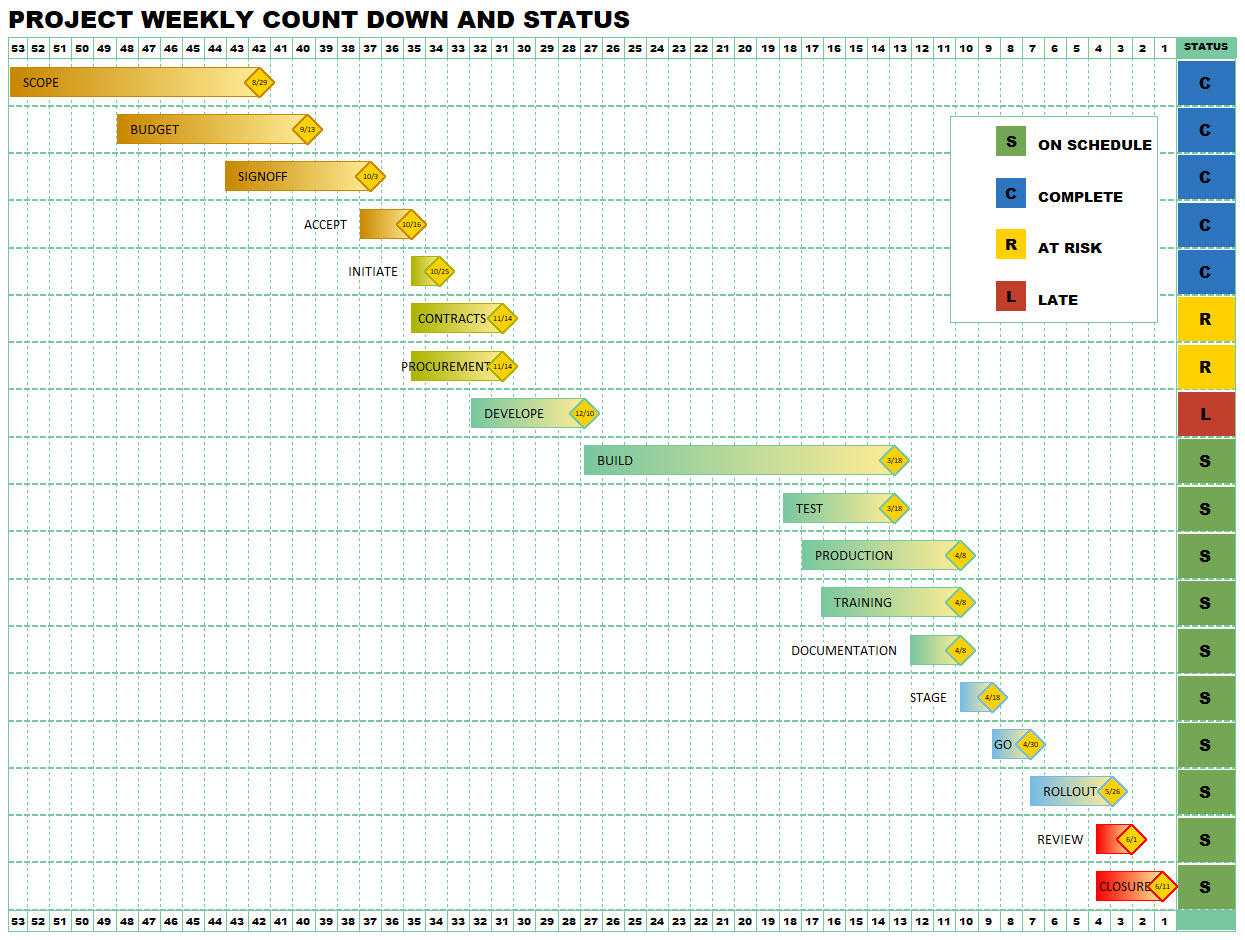
Project schedule examples made with Milestones

Milestones Professional makes planning, organizing, communicating and tracking projects fast and easy. Designed for anyone who spends time scheduling or managing projects, Milestones Professional makes fast work of scheduling efforts. Project managers who need to put together presentation ready project schedules will find Milestones Professional to be a scheduling software product that is truly a joy to work with.

Project Weekly Countdown and Status

This project schedule example illustrates a simple “countdown” schedule, counting down by weeks from week 53 to week 1. The Gantt chart portion of the example includes colored Gantt chart bars with colors starting with a dark color and fading to a lighter color on the right. The Gantt chart example includes a colored diamond symbol marking the schedule end date. The task name for each step in the Gantt chart is shown inside the bar. In addition to the schedule, a status column shows at a glance the status of each task. For tasks in the Gantt chart which are Complete, the entry is filled blue with the letter C. For tasks in the Gantt chart which are On Schedule, the entry is filled green with a letter S. At Risk tasks are indicated yellow with the letter R and Late tasks are shown red with the letter L.

Hardware and Software Programs

This project schedule example shows how a project schedule can have a future year compacted to make more room for the current schedule. This is done with Milestones Professional’s logarithmic timescale feature. The first two years are shown three times as wide as the last year. In the gantt chart area, a variety of milestones are used to show project progress.

Project Status Schedule

This schedule includes many items typically seen in a project dashboard chart. Overall Status is displayed at the top while the status of individual project components can be seen in the Status and % Complete columns.

Contract Review – Earned Value Report

Earned Value is used by many contractors to monitor project plan, actual work and scheduled work to determine if a project is on track. Earned value shows the amount of budget that has been used and how much of the budget SHOULD have been used. It’s a way of measuring and monitoring project cost performance. Many government contractors are required to report earned value. The Milestones schedule example shows the project tasks in the gantt chart area. On top (overlaid) is a graph showing Present Value (PV/BCWS), Earned Value (EV/BCWP), Budget, and ACWP. Other indicators (CPI, TCPI and SPI) are graphed below the schedule area.

Hardware Development

This project schedule example shows a hardware development project over a 4 year period. A portion of the last year is shaded with a Milestones Professional “curtain”. Phases of the project are illustrated in the gantt chart using a variety of colored bars and milestone symbols.

Untitled project example

This project example illustrates the placement of the date heading on one of the task rows in the schedule. Putting the date heading in the middle of the schedule is helpful when producing timeline schedules. In this case the schedule is a monthly count down from month 12 to 1.

Integrated Master Schedule – Project Roadmap

An Integrated Master Schedule (or IMS) is the top level schedule which shows a “big picture” of often very complex projects. It may be a schedule for several components of a larger project and is typically linked to lower level Integrated Master Plans. Milestones Professional makes it easy to create and maintain Integrated Master Schedules.

NASA Integrated Schedule

This is one of the schedules used to manage the Space Shuttle Mission STS-104 which launched in July 2001. NASA has used Milestones Professional for over 20 years for scheduling complex mission schedules. A custom space shuttle symbol can be seen near the scheduled launch date. Milestones Professional is an excellent tool for creating complex schedules which must be updated frequently and presented to management.

This presentation project schedule is an example of an integrated master schedule. An integrated master schedule is a compilation of individual projects and is used to coordinate complex projects across project teams. With an Integrated Master Schedule (IMS), the Project or Program Manager can better manage and control a complex project. Integrated master schedules are frequently used in conjunction with government projects.

Development Scenario 1

This presentation project management chart example shows a high level overview of a development project. Colored gantt bars with a variety of borders are used to make the schedule pop. This project management schedule shows dates from July 2018 to July 2022. The top date heading shows Months using a frequency of 6. One month increment is shown for each 6 months on the project schedule.

Key Finish Dates, Project Omega

This presentation project management chart example is a basic gantt chart example which shows key dates in a company’s major project. The text for the bars in this gantt chart example is picked up from the “task name” column. The gantt chart is outlined. A WBS column shows the WBS numbers for each task. The WBS numbers are derived based on the task outline level. A column showing each project task’s percent complete is shown. The presentation project schedule has several vertical curtains indicating production shutdowns.

Birds on a Wire schedule

Use any search engine to look for “Birds on a Wire” and you won’t find too much about project management or project schedules.  Rather, you will find listings by electric companies studying the problem of birds on electrical wires, bird watchers photographing birds sitting on wires, people selling unique products involving birds and wires and even consultants who have named their companies “Bird on the Wire Consulting”.   A Birds on a Wire Chart is typically a one or two page project management chart which displays milestones which are key to the completion of one or more projects.  The “birds” represent the individual milestones on the schedule while the “wires” are the horizontal bars which span the date range of each task row in the project schedule.

Key Project Dates

This single page presentation project schedule is in the basic form of a Gantt chart but shows the project schedule in a condensed form so that it is easily presented in a meeting. The first row on the project schedule represents the “key project dates.” Links from these dates on the project schedule to the more detailed plan for the corresponding task are shown with a dotted vertical line.

Key Project Milestones and Events

This project schedule example shows a Gantt/milestone schedule which presents the key milestones for several hardware and software items

This presentation project schedule format is another example of an integrated master schedule. An integrated master schedule is a compilation of individual projects and is used to coordinate complex projects across project teams. With an Integrated Master Schedule (IMS), the Project or Program Manager can better manage and control a complex project. Integrated master schedules are frequently used in conjunction with government projects.

Roadmap linked to Microsoft Project

This Project roadmap schedule is a high level schedule linked to multiple Microsoft Project schedules.

Wonderful Widget Project Plan

Tripod Overview

Top Level Schedule

Stoplight Sampler

See More Stoplight examples

© Copyright 2026 - KIDASA® Software, Inc - Privacy Policy - Cookie Policy - Milestones Professional® and KIDASA® are registered trademarks of KIDASA® Software, Inc.