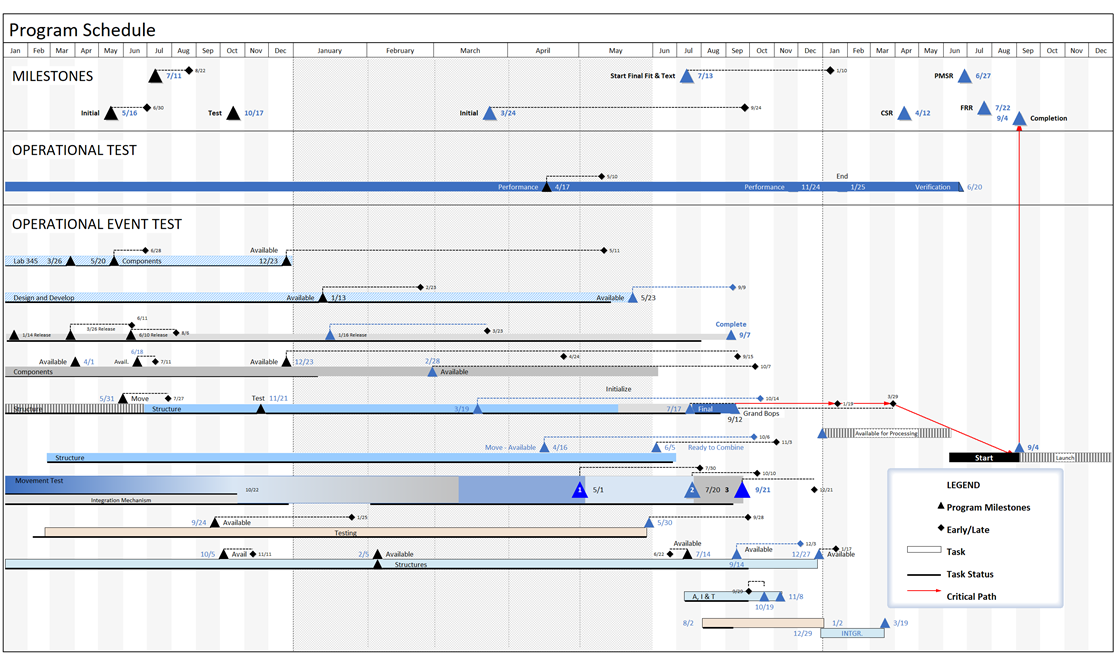
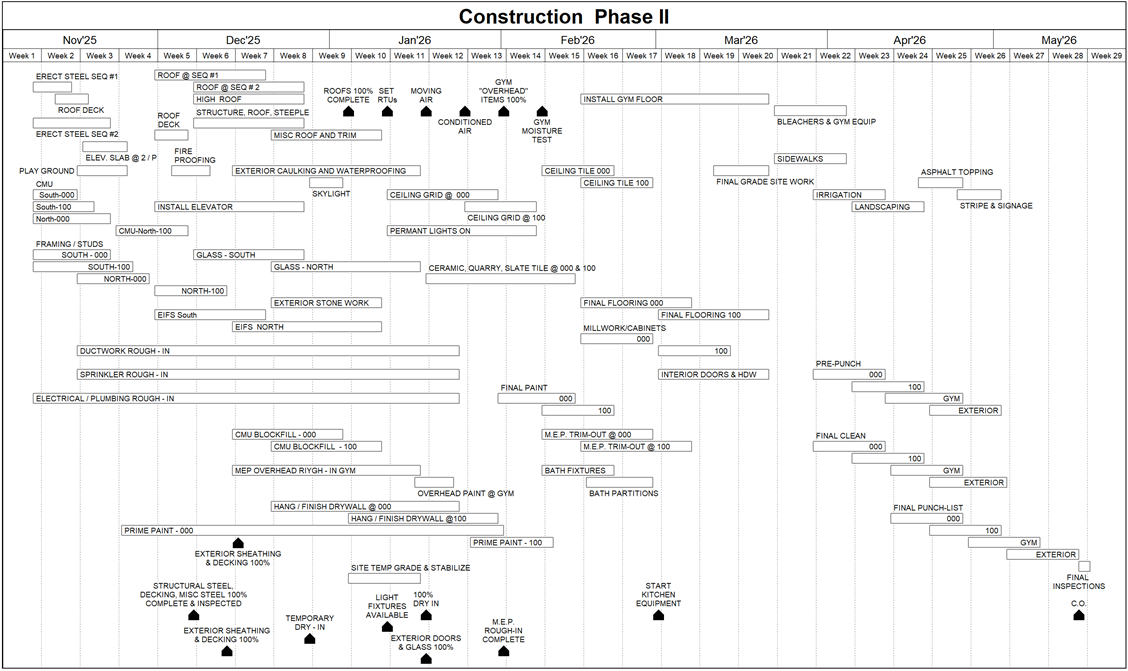
Milestones Professional is a powerful tool for creating presentation-ready project schedules—either from scratch or by importing data from software like Microsoft Project, Oracle Primavera, or Excel.
Designed for anyone involved in project scheduling or management, Milestones Professional simplifies planning, organizing, communicating, and tracking projects, making the entire process faster and more efficient.
CREATE PRESENTATION REPORTS IN MINUTES
- Highlight your Project’s tasks using a huge assortment of presentation-ready bars and symbols
- Show your Project’s key dates with built in and customizable date ranges
- Give a clear concise one-page report of your Project by adding columns, legend, Datagraphs, baseline, status, and more to your schedule
TOP LEVEL REPORTS FOR MS PROJECT & PRIMAVERA
- The Milestones Professional Microsoft Project to Milestones Wizard offers a variety of built in reports you can generate from Microsoft Project, Primavera information or any XML, XER, MPP or MPX file.
- Milestones Professional Link to active MS Projects gives you full control of building your schedule while linking it to Microsoft Project.
- Any Milestones Professional schedule you created can be tagged to your Microsoft Project, Primavera, or Excel information for future Refresh.
VIEW MPP, XER, XML FILES
- No need to have Microsoft Project of Primavera installed to view the information in an MPP, XER or XML file with Milestones Professional Quick View
- Quick View interprets the MPP, XER and XML files information displaying it in the Milestones Professional’s format or as a text file
A SPREADSHEET INTO A PRESENTATION SCHEDULE
- Getting schedule information into Milestones Professional from just about any other Windows software package is easy. Simply copy information from another application to the Windows clipboard, and then paste into Milestones Professional.
- When the spreadsheet changes, Milestones Professional Refresh feature updates the Milestones Professional schedule highlighting the changed dates.
MANAGE LARGE OR MULTIPLE PROJECTS
- Master schedules: Merge two or more sub-schedules into a single master schedule to get a top-level view of multiple projects.
- Symbol links between schedules: Manage multiple projects through symbol linking.
- Hyperlinks Any symbol or task row on the schedule can have hyperlinks to other schedules, documents or Internet web pages.
“AT A GLANCE” REPORTING
- Getting schedule information into Milestones Professional from just about any other Windows software package is easy. Simply copy information from another application to the Windows clipboard, and then paste into Milestones Professional.
- When the spreadsheet changes, Milestones Professional Refresh feature updates the Milestones Professional schedule highlighting the changed dates.
DISPLAY COST, EARNED VALUE, AND MORE
- Send the actual schedule to a colleague. (They can view it with their software or with our Free Milestones Viewer!)
- Create a PDF of your report and share it with a click of your mouse
- Save your schedule as an HTML page (which can include hyperlinks to other schedules).
- Publish a complete hierarchy of schedules for Internet/Intranet use.
- Copy all pages of the schedule to PowerPoint.
- Include the schedules in other documents, such as PowerPoint, Word, Excel, and other Windows documents.
SHARE YOUR REPORTS WITH A SINGLE CLICK
- Built-in Earned Value (EV) calculations: Produce reports showing Earned Value, Planned Value, Actual Costs, CPI, SPI, EAC, and EVMS fields using user-entered values, calculated values, imported values from MS Project, or a combination of these options.
- Calculation/Indicator SmartColumns: Perform mathematical (+, -, X, /) on values which are entered into columns for tasks on the schedule. Optionally display an indicator easy insight into key project metrics.
- DataGraphs and ValueSets: DataGraph feature allows time period views of dollars, manhours and other values in a project management presentation schedule. Values can be graphed on individual graphs or on the same graph for easy comparison.


